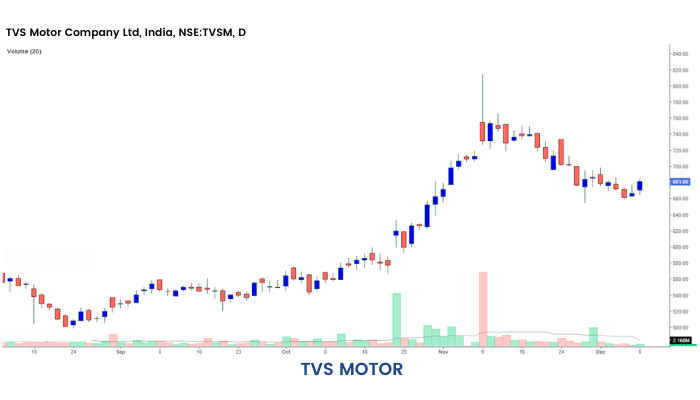
Volume
In this section, we introduce the second aspect of charting. This is called volume. Traded volume is the number of quantities a stock has changed hands. The volume is shown as a subgraph in the price-time chart, below the price window. Higher the volume in any particular move, the greater is the conviction in that move to continue greater distance in that direction. However, if the volume is on the lower side during a move, the stock is generally bound to lose momentum.
Generally, during range-bound phases, the volume is low.

An important point regarding volume is that traded volume in absolute terms has no significance.
When we talk about higher or lower volume, it is relative to average volume over certain time periods.

Apart from traded volume, one important concept regarding volume is delivery %. In the market, a person can first buy shares and sell by the end of the day. He or she can do the reverse too. This is called intra-day trading. However, if an investor is having a positive view he may buy the share and carry forward it for a number of days. This is called taking delivery of a share. Hence if there is a price rise of a stock with a high % of delivery volume, then this signifies a positive conviction in the stock. Similarly, if a lot of people are long term negative about a stock, they may sell the stock and give delivery. Markets are driven by buyers and sellers. People who have a positive view of security are called bulls and people who have a negative view are called bears. The price of a security in a market is determined by supply-demand dynamics of any stock. If the supply is high and a lot of people are looking to sell the stock, then there are fewer available buyers, and the price is likely to decline. Hence a fall in price with high delivery % is considered negative for a stock.


