Some Real-Life Examples
Let us discuss sector rotation with the help of technical charts. Here are some examples.
1. NIFTY AUTO:

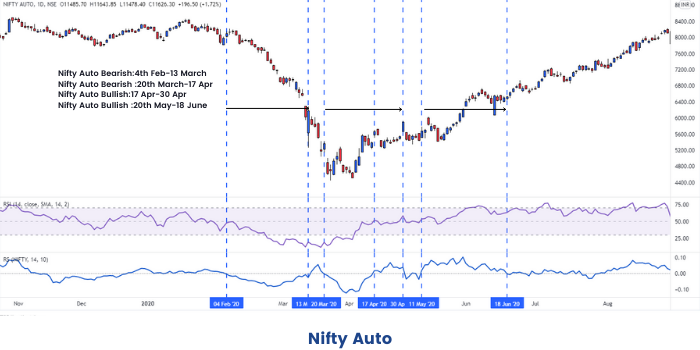
The above is the chart of NIFTY AUTO.
As we can see, from 4th Feb to 13th March 2020, NIFTY AUTO was in Bearish or downward trend, whereas the RS Indicator was less than zero, also showing a bearish trend in NIFTY 50. The RSI, also showed a bearish pattern during this time. Anyone looking to buy stocks in NIFTY Auto, should have waited until 17th to 30th April, when the 2 indicators, and the chart confirmed a positive trend.
2. Maruti:

Maruti, from the Automobile Industry, showed a positive trend from 26th May 2020. Whereas, RS was greater than zero, and the RSI was greater than 50, both confirming a positive trend. If we see, Nifty Auto was also in a positive trend from 27th May, 2020.
3. NIFTY FMCG:

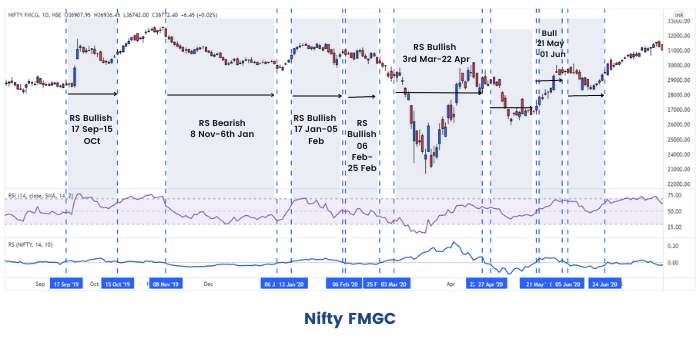
The above is a chart of NIFTY FMCG.
The Bearish Patterns were on 27th April to 20th May, and,
The major bullish pattern was from 3rd March to 22nd April.
The trends were also confirmed by the 2 indicators.
4. Hindustan Unilever:

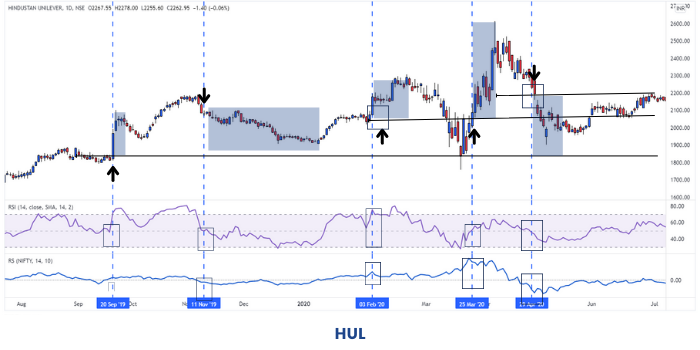
As we can see Hindustan Unilever, which belongs to the FMCG sector, also showed an upward trend from 29th March 2020.


