Triple-Top and Bottom Patterns
Here in this section, we will learn Triple Tops and Triple Bottoms in Point and Figure charts.
All Point and Figure patterns which generate buy and sell signals are built around the two basic double-top and double-bottom patterns; however, the stronger the resistance or support, the more important the subsequent buy or sell signal. Consequently, a triple-top buy or triple-bottom sell where the level breached has been attained twice already, will lead to a stronger move.
The reason that the wider pattern generally leads to a stronger and more reliable signal is that the battle for control has taken three upthrust columns instead of two. Having been forced back twice, demand from the bulls eventually manages to overcome supply on the third attempt by breaking up above the resistance level.

Continuation triple-top buy signal in 3-box reversal charts

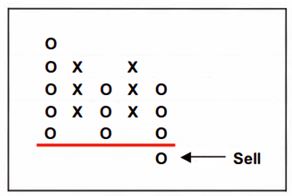
Continuation triple-bottom sell signal in 3-box reversal charts
1-box charts
In 1 -box charts there is no difference between the patterns as there is with 3-box double-top/ bottom and triple-top/bottom patterns. The only difference is that the 1 -box continuation semi-catapults and 1 -box reversal fulcrums are wider.

Variations in bullish fulcrum patterns in 1 -box charts
The wider the pattern and the more times the levels are tested, the stronger the resultant signal and subsequent move in that direction. Just like double-top and double bottom patterns, triple-top and bottom patterns can be continuation, as well as reversal patterns.


