Valuation Ratios
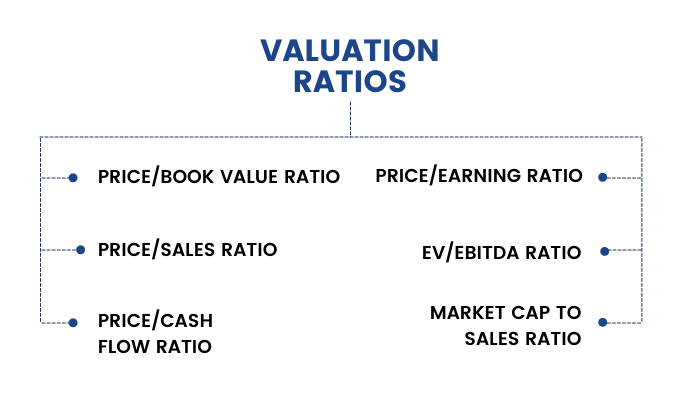
Lastly, we will discuss valuation ratios that measure a company's financial strength to its market value.
What are Valuation Ratios?
Valuation ratios measure the quantity of an asset or flow (e.g., earnings) associated with ownership of a specified claim (e.g., a share or ownership of the enterprise). It compares the stock price of the company with either the profitability of the company or the overall value of the company.


1. Price/Earnings Ratio (P/E):

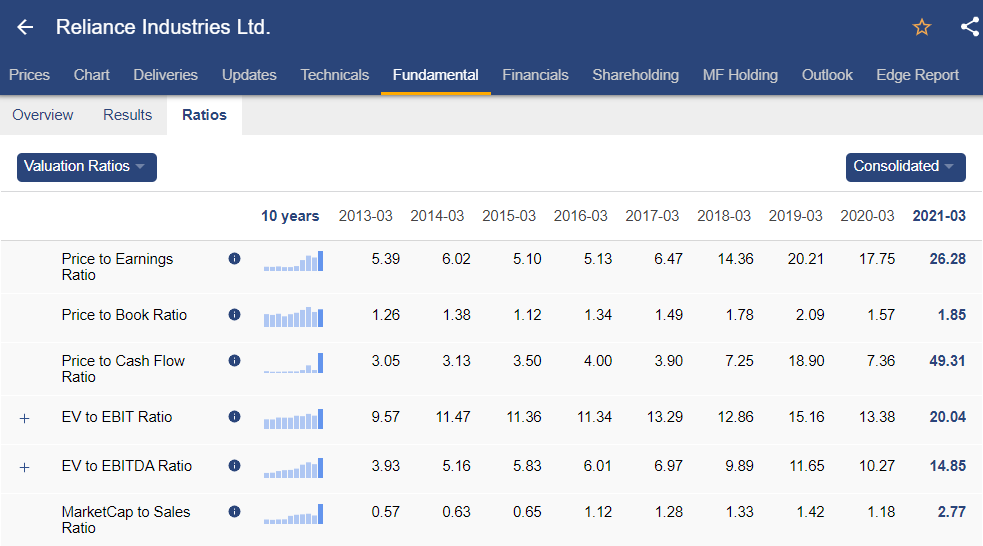
The P/E ratio expresses the relationship between the price per share and the amount of earnings attributable to a single share. In other words, the P/E ratio tells us how much an investor in common stock pays per rupee of earnings.
For example, if the P/E of a certain firm is 10 then it simply means that for every unit of profit the company earns, the market participants are willing to pay 10 times. A higher P/E ratio could mean that the stock is over-valued or else could mean that investors are expecting high growth rates in future and vice-versa.
Stock of company ABC is priced at ₹ 78.78. The company’s profit for the year was ₹ 10,000 and its number of outstanding shares is 1,250.
EPS = 10,000/1,250 = ₹8
P/E ratio = 78.78/8 = 9.85
2. Price/Sales Ratio (P/S):

This ratio compares a company’s stock price to its revenue. This ratio is also known as a Sales Multiple or Revenue Multiple. A low P/S ratio implies that the stock is undervalued while a high ratio indicates that the stock is overvalued. P/S ratio is sometimes used as a comparative price metric when a company does not have positive net income.
XYZ Corporation has 10 lakhs outstanding shares with the stock currently trading at ₹10 per share. The annual sales of the company stood at ₹1 crores.
Therefore, P/S Ratio
Price/Sales ratio = ₹10/ (1 crores/10 lakh) = 1
3. Price/Cash Flow Ratio (P/CF):

This ratio compares a company’s stock price per share to operating cash flow per share. It is usually considered a better measure than P/E ratio since cash flows cannot be manipulated as earnings (which includes depreciation, amortization and other non-cash expenditure). Hence, it works well for the companies that have large non-cash expenditures.
For example, the stock price of ABC Corporation is ₹10 and its number of outstanding shares is 100. The operating cash flow of the company is ₹ 300 in a given year.
Cash flow per share = 300/100 = ₹3
Thus, Price to Cash flow share = 10/3 = 3.33
This means that the firm’s market value covers its operating cash flow 3.33 times.
4. Price/Book Value Ratio (P/BV):

This ratio is often interpreted as an indicator of market judgment about the relationship between a company’s required rate of return and its actual rate of return. Assuming that book values reflect the fair values of the assets, a price to book ratio of one can be interpreted as an indicator that the company’s future returns are expected to be exactly equal to the returns required by the market. An asset's book value is equal to its carrying value on the balance sheet, and companies calculate it netting the asset against its accumulated depreciation.
A ratio greater than one would indicate that the future profitability of the company is expected to exceed the required rate of return and values of this ratio less than one indicate that the company is not expected to earn excess returns.
For example, a company has ₹150 million in assets on the balance sheet and ₹125 million in liabilities. There are 10 million shares outstanding and the price of each share is ₹5.
Book Value per share = (150-125) / 10 = 2.5
P/BV ratio = 5/2.5 = 2
This implies that the market price is valued at twice its book value.
5. Enterprise Multiple (EV/EBITDA):

EV/ EBITDA or Enterprise Multiple is used to determine the value of a company. It looks at a firm in the way a potential acquirer would buy considering the company’s debt. It is a better valuation metric since it remains unaffected by changing capital structures and offers fairer comparisons of companies with capital structures that differ. It removes the effect of the company’s non-cash expenses on its value.
A high EV/EBITDA ratio means that the company is overvalued and a low ratio means a company is undervalued. A company with a low enterprise multiple can be considered as a good takeover candidate.
Example - The Enterprise Value of a company is ₹10 crores. (EV= Market capitalisation + Debt + Minority Interest + Preferred Shares- Total Cash and cash equivalents). The EBITDA is ₹2 crores. Then its EV/EBITDA multiple is 10/2=5.
It is extremely difficult to arrive at the correct valuation at times since the company’s enterprise value takes into consideration a lot of factors and varies from industry to industry.
6. Market Cap to Sales Ratio:

This ratio determines how much price is one willing to pay for every rupee of sales generated by the company. It is an important ratio as it combines two very important aspects namely sales and the market price of the share. It is useful for valuing a company’s actual price.
If the ratio is more than one, then it is considered to be over-valued and if it is less than one, then it is considered to be under-valued.
Market cap to sales ratio is preferred more over PE ratio because it does not take into account interest and taxes or any non-cash items thus, it can’t be manipulated. But PE ratio can be manipulated as it takes into account non-cash items too.
Example - Suppose a company ABC has a price of ₹10 and the total number of outstanding shares being 100
Therefore, market cap = ₹10 x 100 = ₹1,000
Now suppose the company generates annual sales worth ₹500
Market Cap to Sales ratio = 1,000/500 = 2
This means you will be paying ₹2 for every rupee of sales that a company makes if you wish to buy shares of the company.


