Types of indicators
We have briefly discussed the concept of indicators & oscillators previously, but there are several broad categories of technical indicators that we will go through in this section. So let's start:
Indicators and oscillators can be classified into four broad categories. They are as follows:
- Trend Following Indicators
- Momentum Indicators
- Volatility Indicators
- Volume Indicators
Let us understand the characteristics of each one of them in detail:
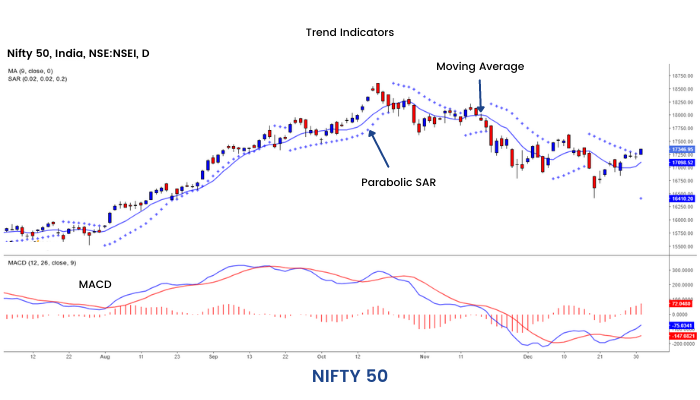
1. Trend Indicators
These kinds of indicators indicate the direction of the trend. For example, in the moving average, price data is smoothed and the trend is represented as a single line. Due to this smoothing process these indicators tend to lag price changes and are called Trend following indicators. Some of the Trend following indicators are Moving Average, MACD, ADX, Parabolic SAR etc.

2. Momentum Indicators
Momentum measures motion. Momentum indicators are technical analysis tools used to determine the strength or weakness of a stock's price. Although their main use is to indicate the strength of a trend, momentum indicators also indicate when a trend has slowed and possibly ready for a change. Some of the momentum indicators are Stochastic, RSI, ROC, William % R, CCI etc.

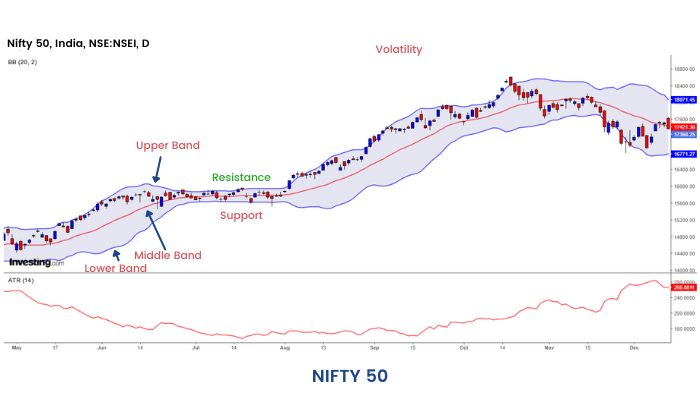
3. Volatility Indicators
These are technical analysis tools which look at the changes in market prices over a specific period of time. The faster prices change, the higher is the volatility and similarly the slower prices change, the lower is the volatility. Some of the volatility indicators are Average True Range, Bollinger Band etc.

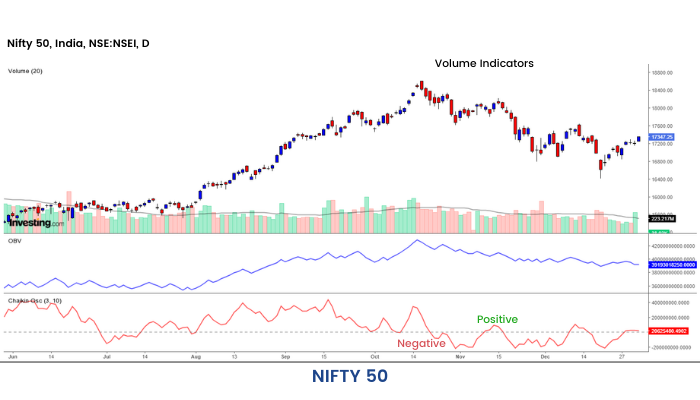
4. Volume Indicators
Volume measures the total number of stocks traded at a particular point in time. It is a very powerful tool to evaluate a security's bull and bear power. A high volume indicates strong buying pressure, which pushes the indicator higher and viceversa. Some popular volume indicators are the Chaikin oscillator, OBV, etc.


